INTERACTIVE EXPLANATIONWhy does food seem different when your nose is blocked?
Find the hidden route from mouth to nose. Keep a virtual sample the same, change which messages can get through, and inspect real nasal images and an odor receptor.
Enable JavaScript to change the conditions and run the interactive experiment.
Make a discovery
Aroma has a route from the mouth into the nose. Flavor combines several kinds of information; changing a route does not give us a formula for somebody’s experience.
- Trace the outside and mouth-to-nose odor routes.
- Distinguish taste, smell and other oral sensations.
- Separate a material stimulus from a neural message.
- Explain what matching two sample facts does—and does not—establish.
- Read an actual study’s measurement without turning time into flavor strength.
- Inspect a real receptor structure while respecting what a static model cannot show.
Make a prediction
The virtual sample stays in the mouth. Aroma access is interrupted. What can this model conclude?
- Every sensation disappears.
- An oral taste path remains; exact flavor is not calculated.
- Sweetness must remain exactly unchanged.
Read the explanation
A path’s availability is not a subjective intensity measurement.
Understand it
A familiar experience hides several inputs
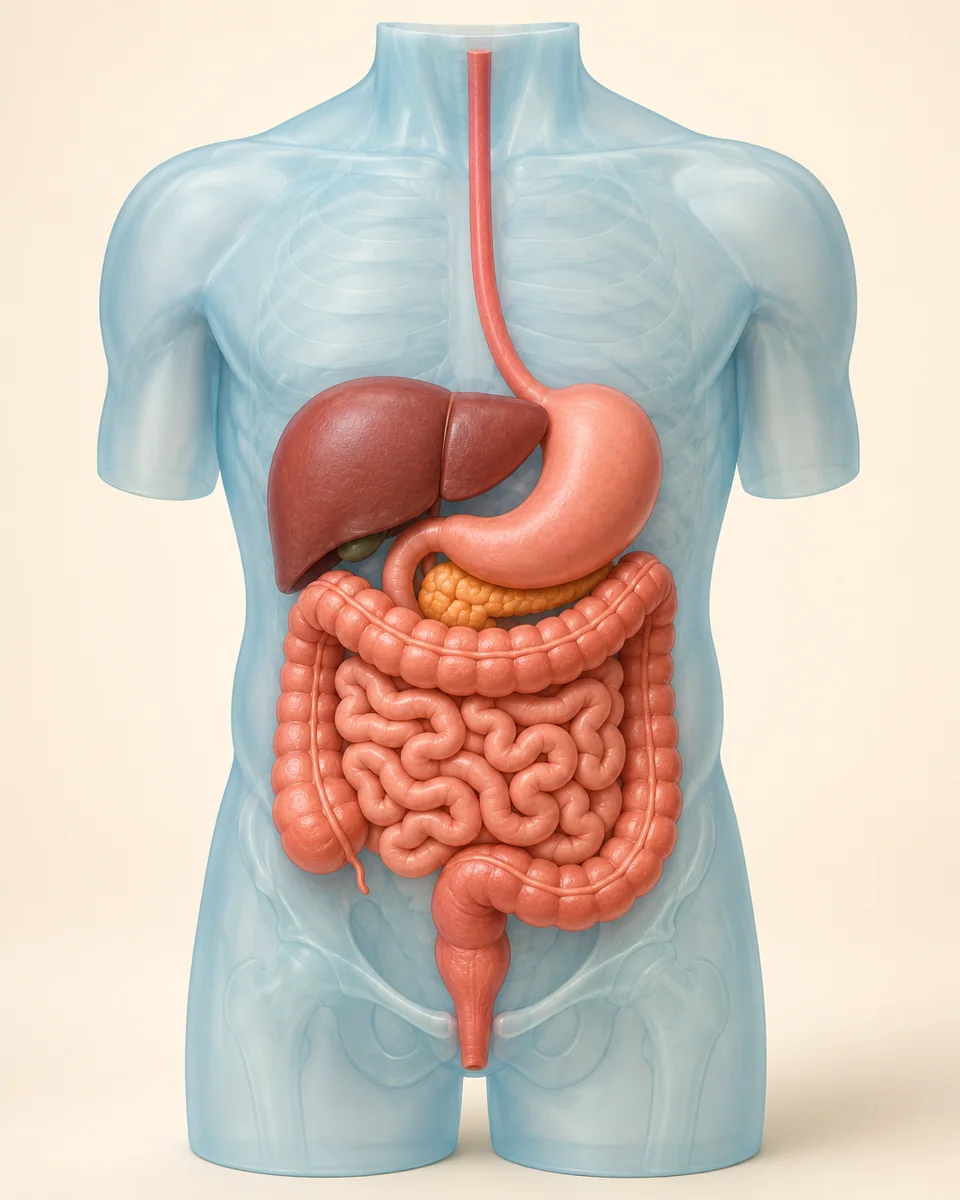
Food has texture and temperature. Substances dissolved in the mouth can stimulate taste cells. Some substances can also enter the air and stimulate smell-sensing cells. Together with chemical sensations and other influences, these help build flavor.
Find the back connection
An outside aroma can enter through the nostrils: the orthonasal route. Aroma from a sample already in the mouth can travel around the rear connection to the nasal cavity: the retronasal route. The palate separates the spaces at the front.
Change one route
Our switch interrupts aroma access while preserving the virtual sample. For a sample in the mouth, an oral taste route remains available. That result does not establish that every reported taste quality stays exactly constant.
Change the carrier
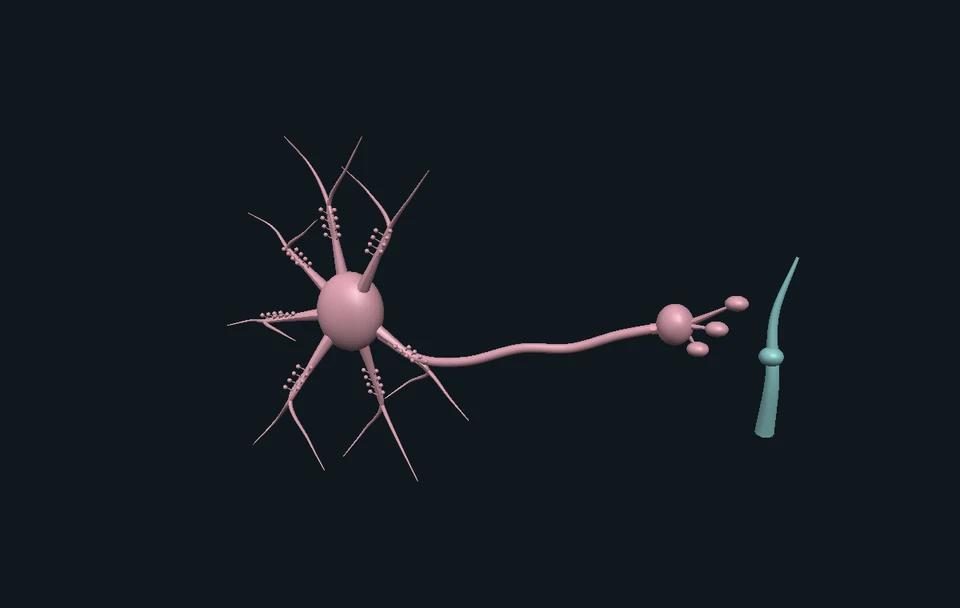
Aroma is a physical stimulus at olfactory sensory cells. Neural signals carry information onward. Round material tracers and white diamond messages are different symbols because little pieces of food do not travel along nerves into the brain.
Look closer at the science
Taste is part of flavor
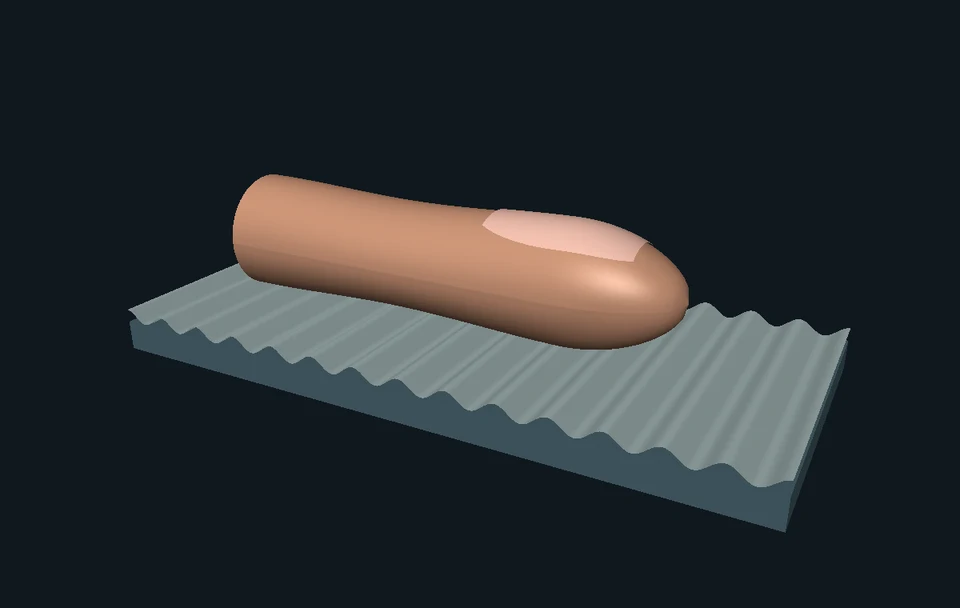
Sweet, sour, salty, bitter and umami are at least five well-established basic taste qualities. Texture, temperature, aroma and chemical sensations also matter. Mint cooling illustrates chemical sensation; a sample need not become physically colder. No tasting task is required here.
The tongue-map trap
The familiar drawing of five exclusive tongue territories is misleading. Different taste qualities can be sensed at multiple locations. That does not mean every taste cell or every region has identical sensitivity. NIDCD and Collings’ regional-stimulation research support that distinction.
A route model, not a personal forecast
The interaction is a directed reachability model. It asks whether the selected sample has a path to a sensory interface. Its edges distinguish material transport, sensory interaction and neural information. Animation speed, particle count and spline length are display choices, not concentration, airflow or strength.
Taste and odor can interact
Green and colleagues studied specific tastants, odors and food mixtures. In their conditions, sucrose could enhance reported retronasal odor intensity. This is a reason to avoid assuming that independent-looking pathways simply add fixed percentages. The study supplies no universal flavor calculator.
Geometry can influence transport
Ni and colleagues studied how the shape of a mouth–nose passage can guide flow. Their physical model, derived from one human CT, used water and fluorescent tracer particles under matched flow conditions—not direct measurements of odor molecules in a person. It does not predict every person’s experience. Our animation is not a fluid-dynamics solution.
What a nasal shape really represents
Keustermans and colleagues built statistical shapes from 46 clinical CT patients. Source Figure 1 shows airspace segmentation and smoothing. Figure 4 divides an average shape into practical anatomical regions; these boundaries are not the measured positions of all smell-sensing neurons. The original head shown here is a separate teaching model.
Two matching facts leave many unknowns
Cousens and colleagues used two fruit juices reported as having 62.5 g/L sugar and 0.15 g/L sodium. Matching those values does not establish identical acids, aroma compounds, complete chemistry or perception. The 20 mL vials described in the apparatus do not establish how much each participant drank.
Measure the right quantity
In the analyzed physiological data, ten participants remained after exclusions. Table 1 reports median cumulative retronasal-airflow durations during the interval from fluid contact to behavioral response: water 1.21 s, S1 1.60 s and S2 1.84 s. Those are defined group summaries, not liters, universal breaths or flavor-strength ratings.
Read an actual recording
Cousens Figure 2 includes an individual pressure-related signal and parahyoid EMG, pooled direction probability, and participant heatmaps. The nasal cannula was not sealed, so the recording did not establish absolute airflow volume. The figure is retained intact; no invented waveform or raw samples are substituted.
The sampling clock
The source acquisition system sampled at 250 Hz: one sample interval is 0.004 seconds. A 12-second half-open window has 3,000 samples. Starting at −6 seconds, index 2,999 is at 5.996 seconds. The cursor teaches timing only; it does not digitize the figure’s vertical values.
A real molecular fit
PDB 8F76 is a cryo-EM structural model of human odor receptor OR51E2 bound to propionate in an engineered signaling preparation. It contains 8,170 modeled atoms and has a reported global resolution of 3.10 Å. Our full view uses represented Cα positions; gaps are not joined. Supporting proteins can be hidden without claiming they were absent from the experiment.
Distances are not smell thresholds
The five ligand heavy atoms and Arg262 coordinates place the selected nitrogen–oxygen contacts at about 2.7 Å. One ångström is 0.1 nanometers. Extra calculation digits do not establish experimental precision, and global resolution is not an atom-by-atom error bar. A static coordinate distance is neither binding affinity nor a person’s smell threshold.
Where this is used
Food science
A recipe changes more than one sensory input. Researchers must distinguish ingredient facts from recorded responses and reported experience.
Sensory research
A recording can measure a particular behavior without directly measuring a feeling. Labeling the channel, unit and interval makes that distinction testable.
Structural biology
An experimentally solved receptor lets scientists ask molecular questions. Additional experiments are needed to connect a structural contact with biological function.
Try it yourself: Can you keep the message moving?
Supplies
- Paper
- Pencil
- Optional colored pencils
- A spare paper strip
- Make location cards
Label outside sample, mouth, nostrils, rear connection, nasal space, smell-sensing cells, taste cells and neural information. Pointing works; cutting is not required.
- Trace the outside route
Connect outside sample → nostrils → nasal space → smell-sensing cells. Change from a solid line to a dashed line for the neural message.
- Find the mouth route
Start with a mouth sample. Go around the rear connection to the nasal space. Add a separate dissolved-substance path to taste cells.
- Interrupt one connection
Cover the link from nasal space to smell-sensing cells with the spare strip. Keep the mouth sample fixed. Explain which path remains available.
- Add more sensory contributions
Write texture, temperature and chemical sensation on extra cards. Do these cards tell us exactly how the food will feel or taste? Explain why not.
- Write one supported conclusion and one limit
Our paper model represents a connection from mouth to nasal space. Explain why it cannot tell us how sweet your lunch will seem.
How can you change one path without claiming to predict someone’s whole experience?
This is a paper activity, not a breathing experiment. No food, new scents, nose holding, breath control, blindfold, powder, spice challenge or personal sensory report is needed.
Check your understanding
A food is already in the mouth. Which route can help its aroma reach the smell-sensing region?
- Mouth → rear connection → nasal cavity → olfactory region.
- Mouth → stomach → directly into smell nerves.
- Mouth → taste buds, because all aroma is detected there.
- Mouth → a tube carrying food particles into the brain.
Answer and explanation
Mouth → rear connection → nasal cavity → olfactory region. This is the retronasal route. The aroma does not have to leave the face and re-enter through the nostrils first.
In our model, aroma access is interrupted while the same virtual sample remains in the mouth. What follows?
- Every contribution to flavor must disappear.
- An oral taste route remains available, but the model cannot predict exact perceived flavor.
- The person's sweetness rating must stay exactly the same.
- The switch proves the person's taste cells are damaged.
Answer and explanation
An oral taste route remains available, but the model cannot predict exact perceived flavor. A taste message can still get through. That does not tell us exactly how strong or different the food will seem.
Why is mint's cooling sensation useful when thinking about flavor?
- It proves every mint sample is physically colder.
- Cooling must be one of the five named basic tastes.
- Chemical sensation can contribute alongside taste, smell and temperature.
- Any cooling feeling must be detected only by odor receptors.
Answer and explanation
Chemical sensation can contribute alongside taste, smell and temperature. Flavor involves more than a sweet/sour/salty/bitter/umami label.
Which tongue illustration would communicate the evidence best?
- Five exclusive zones, each able to detect only one basic taste.
- A diagram claiming every taste cell responds identically to everything.
- Only a bitter detector at the back, with no bitter sensitivity elsewhere.
- Multiple taste qualities possible at multiple locations, with a note about regional differences.
Answer and explanation
Multiple taste qualities possible at multiple locations, with a note about regional differences. Several areas can sense each taste quality. But different cells and areas do not all respond in exactly the same way.
Our aroma tracer reaches the olfactory sensory interface. What should the next stage show?
- The same fruit-colored molecule racing down a nerve into the brain.
- All odor molecules instantly vanishing because the brain ate them.
- A distinct neural-signal symbol, with the physical tracer's teaching route ending at the interface.
- A nutrient entering blood, labeled as the immediate aroma message.
Answer and explanation
A distinct neural-signal symbol, with the physical tracer's teaching route ending at the interface. The round marker stands for aroma material. After a sensory cell responds, a different symbol stands for a nerve message—not a food particle traveling to the brain.
The two study juices report the same sugar and sodium concentrations. What is established?
- Their entire chemistry and flavor are identical.
- Every person must rate their flavor equally.
- Exactly 1.25 g of sugar entered each participant's mouth.
- Those reported concentrations match, while many other properties remain uncontrolled or unspecified.
Answer and explanation
Those reported concentrations match, while many other properties remain uncontrolled or unspecified. A fair comparison starts by separating what is known from what is assumed.
The source table gives 1.84 seconds as a median airflow-duration measure for S2. What can we say?
- S2 tasted exactly 1.84 times as strong.
- It is a published summary of one defined measurement in the study's conditions.
- Exactly 1.84 liters of air reached every person's olfactory region.
- Anyone with a different duration has a smell disorder.
Answer and explanation
It is a published summary of one defined measurement in the study's conditions. This is the median total time with retronasal airflow, added up from fluid contact until the response. It is not one breath's length, flavor strength, air volume or a personal health target.
What does rotating the real 8F76 molecular model let us learn?
- The positions represented in a solved receptor–ligand structure, with limits on resolution and preparation.
- Which whole food everyone will identify whenever this receptor responds.
- The exact path and time taken by the ligand while binding.
- A person's smell threshold from a contact distance of about 2.7 Å.
Answer and explanation
The positions represented in a solved receptor–ligand structure, with limits on resolution and preparation. It is real structural evidence, not a movie of someone's sensory experience.
Sources and model limits
- The head, glasses and moving tracers are original teaching graphics, not scans or a breathing simulation.
- Only route availability is calculated. Flavor identity and intensity remain uncomputed.
- An outside-only sample has not been tasted; this does not mean the person has no taste sensations.
- The model does not diagnose obstruction, sensory loss or any health condition.
- The study figures and published summaries remain separate from the authored animation clock.
- No acquired nasal mesh or unlicensed raw biosensing data are represented as available.
- The molecular view preserves deposited coordinates. It shows neither an observed binding trajectory nor the complete mechanism of food recognition.
Aroma can reach olfactory sensory cells from outside the nose or through the mouth–nose connection.
Sensory cells send information onward; the explanation does not make an individual diagnosis.
NIDCD · how smell worksTaste qualities, smell, texture, temperature and chemical sensation contribute to flavor.
Rejects exclusive tongue territories. No universal flavor percentage is supplied.
NIDCD · taste and flavorRegional response differences are compatible with multiple qualities at multiple locations.
Perception & Psychophysics 16,169–174 (1974). Original abstract read; unavailable threshold data are not reproduced.
Collings · regional taste responseAnatomy and flow direction influence transport in a CT-derived physical airway model.
PNAS 112,14700–14704 (2015). One source anatomy; not a whole-population flavor prediction.
Ni et al. · directional volatile transportSpecific psychophysical tests found enhancement of retronasal odors by taste.
The tested combinations and response categories limit generalization.
Green et al. · taste–odor interactionFigures 1 and 4 document segmentation and approximate regions of statistical nasal shapes.
Royal Society Open Science 5,181558 (2018), CC BY 4.0. Full figures retained; no mesh was acquired.
Keustermans et al. · actual nasal CT shapesFigure 2 and Table 1 provide the actual signals, measurement conditions and duration summaries.
Sensors 22,6817 (2022), CC BY 4.0. Nonsealed sensor; no absolute volume or fabricated raw traces.
Cousens et al. · recorded airflow patternsOR51E2–propionate structure and experiments connect pocket interactions with receptor activation.
Nature 615,742–749 (2023). The browser displays a static coordinate model, not the paper’s molecular-dynamics trajectory.
Billesbølle et al. · odorant recognition8,170 modeled atoms; 3.10 Å global cryo-EM resolution; bound PPI ligand.
Version 1.3. Author chain A is the receptor; other author chains are N, X, Y and Z. PPI is label chain F, author chain A residue 401.
PDB 8F76 · source coordinatesDeposited coordinates and API data are reusable under CC0.
Scientific authors and source hashes remain credited; chemical component dictionaries supply pocket connectivity.
RCSB · data reuse policyIndependent subject review is pending.
Read the sources and model assumptions