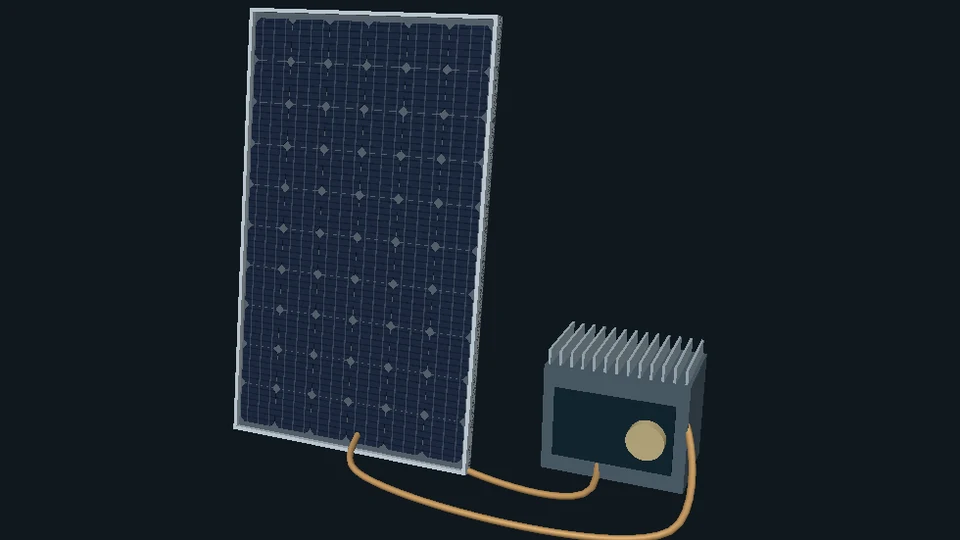
INTERACTIVE EXPLANATIONHow can a planet warm without receiving more sunlight?
Freeze two model temperatures, change infrared transfer and release time. Follow every energy route, move the accounting boundary and compare the model with real atmospheric evidence.
Enable JavaScript to change the conditions and run the interactive experiment.
Make a discovery
Stored energy increases when absorbed input exceeds outgoing energy. A change in infrared escape can start that imbalance before temperatures have changed.
- Separate incoming sunlight, reflected sunlight and outgoing thermal radiation.
- Explain an immediate flux change followed by a slower temperature response.
- Move a boundary to distinguish internal transfers from planetary energy loss.
- Explain continuing greenhouse absorption and emission at equilibrium.
- Compare two heat capacities without changing their final equilibrium.
- Distinguish a measured abundance record, a physical analysis and an illustrative model forecast.
Make a prediction
Sunlight and the initial temperatures stay fixed. Infrared escape falls. What changes first?
- The stored-energy rate
- The Sun’s brightness
- Temperature jumps instantly
Read the explanation
Incoming power now exceeds outgoing power. Finite heat capacity makes temperature respond over time.
Understand it
Begin with a real planet
The EPIC image shows Earth’s sunlit disk using combined red, green and blue filtered exposures. It is real remote-sensing imagery, not a thermal-radiation map. The separate calculation uses a global average: sunlight intercepted by a disk is distributed over four times that area on a sphere.
Name the routes
Some incoming sunlight is reflected. The rest supplies energy to the model surface. The surface emits thermal infrared; part goes directly to space and part is absorbed by the model atmosphere. That atmosphere emits both upward and downward.
Freeze, then change one thing
Keep initial temperatures and sunlight fixed while increasing the model’s infrared absorptivity. Less energy immediately escapes. The surface and atmosphere do not jump to new temperatures; finite heat capacities make them respond over time.
Move the accounting boundary
A transfer from surface to atmosphere is a loss for one and a gain for the other. Enclose both and those internal entries cancel. They still occur physically; they simply do not add or remove energy from the combined system.
Let the response unfold
As the reservoirs warm in this example, their thermal emission changes. The imbalance shrinks. Equilibrium allows sunlight, infrared and internal transfer to continue while both reservoir budgets balance.
Compare a bigger thermal store
With more heat capacity per area, the same initial perturbation changes temperature more slowly. The fixed-feedback equilibrium is the same. Heat capacity is storage per kelvin, not an extra energy source.
Look closer at the science
Two reservoirs with a declared grey layer
The surface is a thermal blackbody. One isothermal atmospheric layer absorbs a fraction ε of surface infrared and emits εσTₐ⁴ in each direction. Solar and thermal channels are separate. Atmospheric shortwave absorption is omitted after aggregate planetary reflection. The layer is a calculation, not a solid lid or an observed emission altitude.
Power per area and stored energy
Q=S₀/4, A=(1−α)Q, Eₛ=σTₛ⁴ and Eₐ=σTₐ⁴. OLR=(1−ε)Eₛ+εEₐ. Surface net is A+εEₐ−Eₛ−F꜀; atmosphere net is εEₛ−2εEₐ+F꜀. Their sum is A−OLR. W/m² is power per area; integrate over seconds to obtain J/m².
Parameter origins matter
S₀=1361 W/m² and α=0.30 are rounded reference choices. σ=5.670374419×10⁻⁸ W m⁻² K⁻⁴ is the displayed CODATA value. The chosen ε values 0.75 and 0.85, surface capacities 2×10⁸ and 4×10⁷, and atmospheric capacity 10⁷ J m⁻² K⁻¹ are illustrative. They are not fitted CO₂ concentrations, actual ocean depths or calibrated climate response times.
Dry adjustment has a specific rule
The optional closure limits Tₛ−Tₐ to 39.2 K: the dry lapse-rate scale 9.8 K/km times an author-chosen 4 km separation. On an active boundary, F꜀=(CₐRₛ−CₛRₐ)/(Cₛ+Cₐ) must be nonnegative; both temperatures then change at (A−OLR)/(Cₛ+Cₐ). A negative required transfer releases the cap. This is not resolved wind, moist convection or the original Manabe model.
Numerics keep energy when regimes change
The model uses RK 4 with event splitting for the dry cap. An initial over-threshold contrast transfers J=(Tₛ−Tₐ−D)/(1/Cₛ+1/Cₐ) upward, conserving CₛTₛ+CₐTₐ. Daily steps reproduce the selected independent reference histories. Integrated net input is checked against the change in reservoir energy.
Balance each reservoir, not just the total
At ε=0.75, Tₛ≈267.0064 K and Tₐ=250 K, the total incoming and outgoing power can match while the surface gains about 116.10 W/m² and the atmosphere loses the same amount. Zero total storage change alone does not establish thermal equilibrium.
Downward radiation is not a new source
A cooler atmosphere can emit toward a warmer surface. For Tₛ>Tₐ, the net longwave exchange εσ(Tₛ⁴−Tₐ⁴) is upward. Both directions belong in the ledger. Internal downward emission must not be counted again as new sunlight.
What the optical endpoints mean
At ε=0, a separate no-longwave-atmosphere reference has T≈254.578 K and no relevant atmospheric temperature or convection. It is not a real atmosphere-removal forecast. At ε=1, direct surface escape is zero, but the atmospheric emission to space continues.
No unsupported conversion to a CO₂ forecast
The calculated dry-adjusted temperature difference for ε 0.75→0.85 is about 4.4645 K. No ε-to-ppm relationship is supplied. It cannot be labeled the warming from doubling real CO₂. Real spectroscopy, abundance records and attribution analyses have distinct quantities and methods.
Where this is used
Read an energy diagram
Choose a boundary before adding arrows. An internal transfer changes the parts without supplying new energy to the whole.
Understand thermal storage
A sustained power imbalance accumulates energy. Capacity controls the temperature response per joule.
Ask what a dataset measures
Atmospheric concentration, radiation and temperature are different quantities. Linking them quantitatively requires appropriate observations and physical analysis.
Try it yourself: Move the boundary on paper
Supplies
- Paper and pencil
- Optional calculator
- The supplied pathway numbers or a printed learning pack
- Draw the three places
Mark surface, atmosphere and space. Add an outline around surface plus atmosphere. Sort radiation routes separately from upward nonradiative energy transfer.
- Write the initial route cards
Use the ε=.75 dry-equilibrium cards: absorbed solar 238.18; surface emission 359.60; atmospheric absorption 269.70; direct escape 89.90; atmospheric emission 148.28 in each direction; upward dry transfer 26.85 W/m².
- Balance each part
Surface gains 238.18+148.28 and loses 359.60+26.85. Atmosphere gains 269.70+26.85 and loses 148.28+148.28. Small residuals arise from rounding. Do not count absorbed surface emission as an additional surface loss.
- Enclose both reservoirs
Cross out paired internal debits and credits. The combined model gains absorbed sunlight and loses the two radiation routes to space. Crossing out an internal pair does not switch off its physical transfer.
- Freeze temperature and change escape
For ε=.85 at those same temperatures, direct escape is 53.94 and atmospheric upward emission 168.05 W/m². Absorbed input remains 238.18. The gain is about 16.19 W/m², before temperatures change.
- Turn a rate into an amount
Separately, a constant 1 W/m² sustained for one 365-day year adds 31,536,000 J/m². Dividing by the combined baseline capacity 2.1×10⁸ J m⁻² K⁻¹ gives 0.150171 K. Label this constant-rate arithmetic; it is not the varying-rate model history or an Earth forecast.
Can the same energy transfer disappear from one ledger and remain real?
Use calculated model cards. No heating or sealed jars. This paper investigation demonstrates accounting; it is not a measurement of the real atmosphere.
Check your understanding
Which description separates the radiation channels?
- Incoming solar is mostly shorter wavelength; Earth mainly emits longer-wave thermal infrared
- Earth returns every absorbed photon unchanged
- Infrared travels only downward
Answer and explanation
Incoming solar is mostly shorter wavelength; Earth mainly emits longer-wave thermal infrared The Sun is much hotter than Earth; sunlight includes infrared too.
At unchanged temperatures, ε goes .75→.85 with fixed sunlight and albedo. What happens immediately?
- The Sun brightens
- Outgoing radiation falls and stored-energy rate becomes positive
- The final temperature appears instantly
Answer and explanation
Outgoing radiation falls and stored-energy rate becomes positive The selected model gains about 16.19 W/m² before temperature changes.
At the later equilibrium…
- Radiation stops
- There is no atmospheric absorption
- Both reservoir budgets balance while transfers continue
Answer and explanation
Both reservoir budgets balance while transfers continue Check the two residuals as well as the combined budget.
In the whole-planet budget, dry surface-to-air transfer…
- Cancels between internal loss and gain
- Creates extra energy
- Carries bulk air directly into space
Answer and explanation
Cancels between internal loss and gain The surface loses exactly what the atmosphere gains.
With the same perturbation, a larger surface heat capacity…
- Raises this model’s final equilibrium
- Approaches the same equilibrium more slowly
- Prevents any future warming
Answer and explanation
Approaches the same equilibrium more slowly Capacity changes storage per kelvin and the time response.
Can a cooler atmosphere emit infrared toward a warmer surface?
- No, cooler matter emits nothing toward warmer matter
- Only if it invents new solar energy
- Yes; both directions matter, and net exchange remains upward here
Answer and explanation
Yes; both directions matter, and net exchange remains upward here For Tₛ>Tₐ, εσ(Tₛ⁴−Tₐ⁴)>0 upward.
Why is a sealed sun-warmed jar not sufficient validation of this atmospheric mechanism?
- Its cover changes air exchange and other processes together
- CO₂ forms a solid lid high above Earth
- The atmosphere cannot absorb infrared
Answer and explanation
Its cover changes air exchange and other processes together A cover changes several heat-transfer routes; appropriate atmospheric evidence is needed.
Can the model’s 4.46 K ε response be labeled warming from doubling real CO₂?
- Yes, ε is automatically CO₂ abundance
- No, there is no supplied ε-to-ppm relationship or complete climate response
- No, radiation cannot affect temperature
Answer and explanation
No, there is no supplied ε-to-ppm relationship or complete climate response This is a mechanism model with author-selected parameters.
Sources and model limits
- Global mean, one grey layer, fixed reflectivity and declared heat capacities. No geography, seasons, circulation, cloud/humidity feedback, carbon cycle or numerical real-world CO₂ forecast.
- Incoming solar includes ultraviolet, visible and infrared; the shorter/longer wavelength distinction is relative, not a claim that sunlight has no infrared.
- The model omits atmospheric shortwave absorption, evaporation and moist convection. Dry adjustment is a chosen stability closure, not a calculated wind or weather field.
- Changing a reservoir definition restarts the trial from its identified reference equilibrium. Visibility and accounting-boundary choices never change physics.
- The Earth photograph and NOAA abundance series are observed evidence. The flux arrows, times and temperatures are model outputs, not satellite observations.
- No CERES measured flux file or measured infrared spectrum is bundled. Source papers are linked with their scope; figures are not republished without rights.
- The paper activity balances calculated route cards. A sealed sun-warmed jar would change several processes and is not validation of this atmospheric mechanism.
Grey two-layer radiative equations
Cannarsa et al., DOI 10.1063/5.0136673, author manuscript v 2 equations 1.3/1.6. The radiative terms match the declared simplifications; this lesson’s dry cap is a separate authored closure.
Cannarsa et al. · Two-layer energy balanceSolar irradiance reference and its measurement
NASA SORCE reference 1361 W/m²; newer TSIS-1 solar-minimum estimate 1361.6±0.3. The lesson holds a rounded value fixed.
NASA · Solar irradiance scienceStefan–Boltzmann constant
NIST 2022 CODATA displayed decimal, SI kelvin and W m⁻² K⁻⁴.
NIST · Fundamental physical constantsRadiation budget and real nonradiative pathways
NASA account distinguishes incoming/reflected/thermal radiation, convection and evaporation. Its historical imbalance figures are not used as current measurements.
NASA · Earth’s energy budgetPlanetary reflectivity
Rounded α=.30 is an Earth-like reference, not a measured constant for every place/year.
NASA · Earth’s albedoDry lapse-rate scale
NOAA/NWS adiabatic glossary. The 4 km effective separation is our choice, not an observed emission height.
NOAA/NWS · Adiabatic processesHistorical radiative/convective adjustment
Manabe and Strickler 1964, Journal of Atmospheric Sciences 21,361–385. This lesson does not reproduce that multi-level model or its figures.
Manabe & Strickler · Convective adjustmentReal Earth image identity
NASA DSCOVR/EPIC, acquired July 6,2015; combined RGB exposures. Original PNG unchanged, no third-party credit present.
NASA · EPIC Earth imageNASA image reuse basis
Educational/informational media guidance; no endorsement implied and no blanket CC license asserted.
NASA · Images and mediaActual globally averaged marine-surface CO₂ record
Lan,Tans,Thoning, version 2026-08, DOI 10.15138/9 N 0 H-ZH 07. Original annual file pinned with header/hashes, 1979–2025. Dry-air micromol/mol, provider uncertainty not relabeled 95%.
NOAA GML · Global CO₂ dataMeasured abundance file and provenance
Source header creation 2026-08-05 10:21:45, timezone unspecified. Values may be revised; retrieved 7 September 2026.
NOAA GML · Annual mean source fileGas-specific infrared measurement
NOAA explanation of calibrated nondispersive infrared CO₂ analysis. Absorption is not mirror reflection.
NOAA GML · Measuring CO₂Observed spectra plus physical analysis
Feldman et al.2015 DOI 10.1038/nature 14240. Clear-sky surface forcing analysis at two sites over 2000–2010; not global all-sky top-of-atmosphere flux.
Feldman et al. · Surface radiative forcingObservationally constrained forcing analysis
Kramer et al.2021 DOI 10.1029/2020 GL 091585. Radiative kernels applied to satellite observations; not a direct CO₂-only measurement.
Kramer et al. · Global radiative forcingData reuse basis
Government information public domain unless annotated; acknowledgment retained. Brytalearn’s plotted rendering is not an official NOAA chart.
NOAA GML · Terms and acknowledgmentIndependent subject review is pending.
Read the sources and model assumptions