Begin with a room that looks ordinary
Air can carry particles too small to distinguish by eye. Our small gold markers are enlarged symbols. The concentration readout, rather than the number of drawn dots, describes the modeled particle mass.
Open a room, plan when to exchange its air, and lift the cover off a particle filter. Follow the mass, inspect real observations, and discover what an AQI number can—and cannot—tell you.
Enable JavaScript to change the conditions and run the interactive experiment.
Exchanging air both brings particles in and carries particles out. The same opening can lower the room’s concentration when outside air is cleaner, or raise it when outside air is more concentrated. A recirculating filter has a different job: it collects particles as room air passes through.
Opening a window always lowers room particle concentration. Is that enough information?
Outdoor exchange has both incoming and outgoing terms. Their concentrations may differ.
Air can carry particles too small to distinguish by eye. Our small gold markers are enlarged symbols. The concentration readout, rather than the number of drawn dots, describes the modeled particle mass.
Will exchanging air lower the room concentration? Compare what is inside with what is entering. Try both the cleaner-outside and smokier-outside cases before turning on a filter.
Move outdoor exchange, filter startup or source stopping to a chosen minute. Scrubbing time recalculates the same plan. Moving an action changes the future pathway without creating a jump in the room’s stored particle mass.
Equal air volumes enter and leave this model. Their particle concentrations can differ, so incoming and outgoing particle mass rates can differ too. The selected flow rate is an assumption, not a measurement of window opening.
A fan moves room air through pleated filter material and back into the room. Some particle mass collects on that material. The cleaner does not add an equal flow of outdoor air.
Air bends around fibers. A passing particle can touch a fiber, continue into it through inertia, or wander into contact through diffusion. These mechanisms do not require every apparent opening to be smaller than the particle.
Open the mass budget. What started in the air plus what entered or was generated must match what remains, what left, and what collected on the filter. Captured material changed location; the model did not destroy its mass.
A reading needs units, a place, a time interval and a method. The selected real record has two 24-hour samples. The separate hourly cards teach NowCast weighting. Neither comes from the fictional room.
Particulate matter is a mixture of airborne solid particles and liquid droplets. PM2.5 is included in the larger PM10 size fraction; adding their mass readings can double-count the shared material. The size conventions are operational and aerodynamic, not exact geometric boundaries for every shape.
Concentration in µg/m³ is particle mass per air volume. Many tiny particles and fewer larger particles can contribute mass differently. Our markers do not encode a measured size distribution, chemistry or particle count.
V dC/dt = E + Q C_out − Q C − D C. V is volume, E is an assumed emission rate, Q is balanced outdoor exchange and D is particle CADR. Time is in hours. This original specialization of NIST’s single-zone mass balance fixes penetration at 1 and surface deposition at 0.
For constant inputs, λ = (Q + D)/V and B = (E + Q C_out)/V. When λ is positive, C tends toward B/λ exponentially. With no removal, C increases linearly at rate B. Each scheduled action begins a new segment from the concentration already present.
The concentration integral J over a segment gives outgoing mass QJ and captured mass DJ. Source addition is EΔt and outdoor entry is Q C_out Δt. J has units µg·h/m³; it is not a deposited dose or a complete measure of a person’s exposure.
In an ideal representation, clean-air delivery rate equals processed airflow multiplied by removal efficiency for a specified particle test. Whole-room change also depends on room volume, ongoing inputs and mixing. Neither a high-efficiency label nor a pictured fan implies an instant room-wide reduction.
Fibrous media can collect through interception, inertial impaction, diffusion and electrostatic effects. The nominal 0.3 µm HEPA test description does not mean all smaller particles pass. Actual performance depends on the medium and test conditions.
The particle CADR in this lesson is not a CO₂-removal rate. Gas sorbents and chemical removal have different mechanisms and limits. A selected pollutant monitor does not represent all indoor-air hazards or comfort conditions.
The separate calculator uses the EPA May 2026 table. Eligible PM2.5 concentration is truncated to one decimal place, interpolated within the appropriate interval and rounded to an integer index. A completed daily calculation uses a 24-hour concentration. Our implemented table ends at 325.4 µg/m³.
For PM, the previous twelve hourly positions are weighted. The base weight is at least 0.5 and approaches 1 when concentrations are steady. Older observations receive powers of that weight. At least two of the latest three positions need valid data. Gaps retain their original hour positions.
A pollutant sub-index uses a defined scale. Overall AQI takes the highest applicable pollutant sub-index; it is not their sum or mean. An index of 100 is neither 100 µg/m³ nor a percentage of personal danger. Other countries may use different systems.
The selected AQS site uses a 24-hour gravimetric sample. Its June 5 and June 8 records do not determine June 7, an hourly peak, indoor concentration or a person’s dose. Historical archive indices can be reprocessed; our displayed indices explicitly use the May 2026 method.
Distinguish media efficiency, particle CADR, processed airflow and room assumptions. Do not treat a product picture as a measured performance curve.
Check whether a number is a concentration, daily index, NowCast or forecast—and where and when it applies.
Identify the pollutant and measurement limits. One reading cannot answer every question about indoor air.
Write June 4–10, 2023. Put 10.5 µg/m³ on June 5 and 60.7 µg/m³ on June 8. Each is a selected 24-hour sample. Mark all other days “no selected sample.”
Circle the higher concentration. Subtract the lower from the higher. Optional: calculate their ratio, then label it a concentration ratio rather than a health-risk ratio.
Use the supplied May 2026 U.S. PM2.5 table. The two sub-indices are 54 and 155. The measurements are from 2023; the stated calculation convention is from 2026.
Write one thing the record cannot show: the June 7 concentration, an hourly maximum, indoor conditions or anyone’s dose. Do not draw a line that pretends to measure the gaps.
Mark possible air entry, air exit and recirculating filtration on paper. Use dashed lines for uncertain routes. Keep the drawing private; no address or uploaded room plan is needed.
Predict what outdoor exchange might do with cleaner entering air, then with smokier entering air. Compare in the digital model. The observation is complete with the supplied data and paper.
Which parts of your answer came from measurements, a calculation, or an assumption?
No smoke, incense, candles, sprays, dust release, filter disassembly or appliance changes. Children should not alter windows or building equipment for this activity. Use current local guidance and a responsible adult for real air-quality decisions.
No, many particles cannot be seen individually Visibility is not a complete particle concentration measurement.
No, the size fractions overlap PM2.5 is included within the PM10 fraction, so addition can double-count mass.
The incoming concentration and the other sources/removals Compare all inputs and removals in the room budget.
No, gas removal uses different mechanisms Particle CADR is not an equivalent removal rate for every gas.
Room change also depends on processed airflow, time and inputs Media efficiency is different from whole-room clearance.
No, the required averaging method and context are missing A brief reading is not an eligible completed daily average.
This subset does not give its value Connecting observations does not create a missing measurement.
It changed location Captured mass leaves the room air and appears in the filter ledger.
Original simplified model derived from equations 1–2, with penetration 1 and deposition 0. This page does not execute FaTIMA or CONTAM.
NIST · Technical Note 2095, FaTIMAPM includes varied solids and droplets; PM2.5 is within the PM10 fraction.
EPA · Particulate matter basicsContext for an assumed indoor source and ambient entry; the model does not estimate a real household source rate.
EPA · Indoor particulate matterParticle filters and gas-removal media have distinct roles and limits.
EPA · Air cleaners and filtersThird edition technical summary, especially pages 33–36. Third-party figures in this publication were not copied into this lesson.
EPA · Residential air cleaners, technical summaryOriginal Figure 1 SEMs retain their scales and caption; path animations are separately authored illustrations.
CDC NIOSH · Lindsley, Chapter FP (2016)Nominal 0.3 µm test description is not an absolute lower particle cutoff or whole-room removal fraction.
EPA · What is a HEPA filter?A monitor does not give a complete representation of indoor air quality.
EPA · Low-cost indoor monitorsMay 2026 document; PM2.5 breakpoints, truncation, interpolation, hourly weighting and missing-data requirements.
AirNow / EPA · May 2026 technical guidance2023 daily parameter 88101 archive, retrieved September 8, 2026. Exact site, POC, method and two-row selection are retained in downloadable metadata.
EPA AQS · Daily PM2.5 data archiveAQS data are public domain. Source and participating monitoring agencies remain credited.
EPA · AQS data reuseGOES-16 image for June 7, 2023. NASA Earth Observatory / Lauren Dauphin, NOAA and NESDIS. Separately credited third-party ground photographs were not reused.
NASA · Smoke Smothers the NortheastConsult current local conditions and responsible adults; the paper activity requires no physical pollution experiment.
EPA · Clean-room guidance during wildfire smokeIndependent subject review is pending.
Read the sources and model assumptions Interactive exploration
Move through a breath, connect space to airflow, then cross the tiny boundary where oxygen enters the blood.
 Interactive exploration
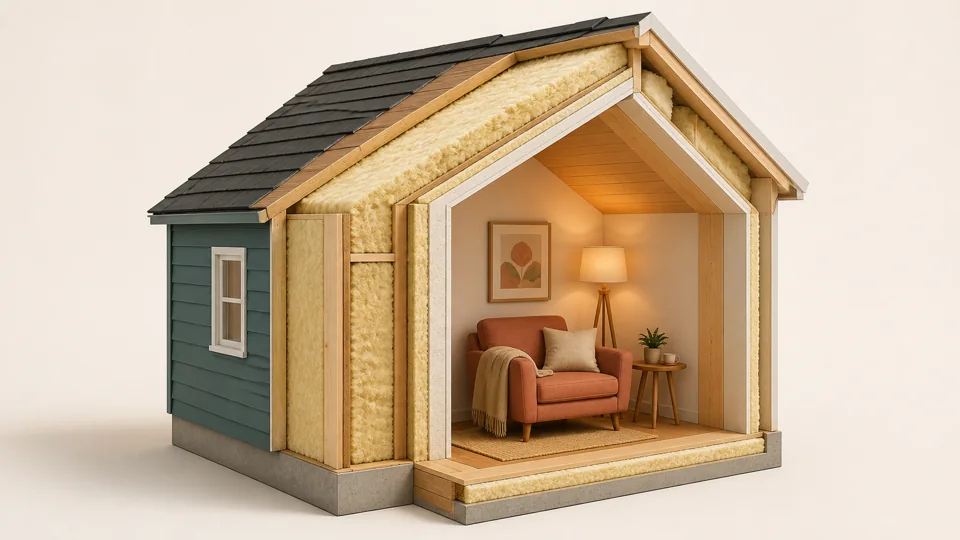
Open a house wall. Swap its added layer, make it thicker, and reverse the temperatures to see why insulation helps in winter and summer.
 Interactive exploration
Follow water above and below the surface. Pave part of the land, change evaporation, and watch the water budget rearrange.