Pull, then let go
Pulling a string stores elastic energy. After release, deformation and motion trade energy. The model begins with zero velocity, just as a held pluck should. Its declared damping gradually removes energy from the retained motion.
Pluck a guitar, move a fret and hear the model. Pull a note apart into harmonics, investigate resonance, and open the instrument beside real research photographs.
Enable JavaScript to change the conditions and run the interactive experiment.
A pluck sets several vibration patterns moving together. Length and tension set their frequencies; where and how far you pull sets their starting weights. A real guitar body helps couple that motion into air, with a response of its own.
Can you make the ideal string’s note higher without pulling harder?
At fixed tension and density, a shorter vibrating span has a higher fundamental.
Pulling a string stores elastic energy. After release, deformation and motion trade energy. The model begins with zero velocity, just as a held pluck should. Its declared damping gradually removes energy from the retained motion.
An active fret changes the boundary. At the same tension and linear density, halving the vibrating length doubles the ideal fundamental frequency. The section behind that boundary remains part of the real instrument but is outside this single-span calculation.
Greater tension gives a higher wave speed in this approximation. Raising tension by a factor of four would double frequency at fixed length and density; the interactive range is smaller. The displayed tension is a model input, not advice for retuning an actual instrument.
The fundamental is harmonic 1. Harmonic 2 is the first overtone, not the second overtone. Each component has its own pattern of nodes and moving regions. A pluck generally excites many components at once.
A midpoint triangular pluck omits even ideal modes. One-fifth omits modes 5, 10, 15 and so on. The same fundamental can remain while the mixture changes, helping explain timbre: the character of a sound.
Ordinary picking gives an initial displacement and then stops forcing. The laboratory driver keeps pushing. Its timing determines how it exchanges work with the moving string. Damping eventually balances average input power.
Removing the force does not instantly remove the motion. Position and velocity continue, while stored energy dissipates. This decaying continuation is ring-down.
In a real acoustic guitar, strings, bridge, plates, cavity and surrounding air interact. A broad moving surface can couple to air differently from a thin string alone. The passive body does not create extra energy; its modes and losses shape the response.
The open length is 0.65 m and linear density is 0.004 kg/m. Tension is 81.796 N, giving an ideal open fundamental of 110 Hz, the A2 reference under A440 tuning. These authored parameters do not describe a measured brand or the specific source instruments.
For a uniform flexible string under constant tension, c = √(T/μ), and fₙ = nc/(2L). The fretted span uses L = L₀2^(−fret/12). The model omits stiffness, real fret compensation, and the additional tension caused by pressing a real string down.
For a triangular displacement h at fraction a of length, Bₙ = 2h sin(nπa)/[π²n²a(1−a)]. Negative Bₙ describes relative phase, not negative energy. The complete shape is a sum of Bₙ sin(nπx/L), with each component then following its damped time solution.
The model solves qₙ(t) = Bₙe^(−σₙt)[cos(ωdₙt) + (σₙ/ωdₙ)sin(ωdₙt)], where ωdₙ² = ωₙ² − σₙ². The additional sine term makes the initial velocity zero. Using only an exponentially shrinking cosine would violate that held-release condition.
The free-pluck loss rate is σₙ = 0.8 + 0.02n² per second, an authored profile rather than a fit to wood or string measurements. Thirty-two modes round the held triangle’s corner. At default settings they retain about 98.05% of the full triangle’s initial energy; the curve is not rescaled to hide that difference.
Each mode has generalized mass μL/2 and energy ½M(q̇² + ω²q²). Its loss rate is 2Mσq̇². At equilibrium displacement, kinetic energy can still be large. For the full triangular pluck, E = Th²/[2La(1−a)]. Doubling h quadruples E under the small-motion assumptions.
Holding force grows with displacement in the linear approximation. Work from rest is ½Fholdh, not the endpoint product Fholdh. For a moving driver, instantaneous power is force times velocity. Source work values with an unresolved force-displacement convention were not imported as the model’s energy.
M = 0.0013 kg, f₀ = 110 Hz and force amplitude 0.01 N define a fundamental-only test. The damping ratio is adjustable from 0.02 to 0.15. This stronger test damping makes settling visible; it is neither the free-pluck loss profile nor a fitted guitar-body Q.
For a constant-amplitude sinusoidal force, steady displacement peaks at f₀√(1−2ζ²) in this underdamped range. Velocity amplitude and average absorbed power peak at f₀. At ζ = 0.05, the displacement peak is 109.725 Hz. A response curve must say which quantity it shows.
The ideal string has a perfectly fixed endpoint, so its endpoint velocity is zero. The same solver cannot claim to transfer a quantified stream of work into a moving soundboard. The 3D construction route is qualitative; predicting the coupled instrument requires the body’s mobility and reciprocal loading.
A line-scan kymograph records one location across time. A laser measures movement; a microphone measures pressure; a pickup has its own response. Their waveforms need not match. The real source evidence preserves distinctions between observed, filtered and simulated traces.
The optional sound uses the model’s displacement at x = 0.41L, 48 kHz mono sampling, a fixed gain and short edge fades. The 32 modes remain below the sample band in the selected range. It is not calibrated acoustic pressure or a prediction of this wood’s exact timbre. Its real-time note speed differs from the slowed animation.
Players change excitation position as well as pitch. The ideal mode tray explains one mechanism; a real hand also changes several contact and timing variables.
Makers work with connected structures, materials and air. Actual mobility and mode measurements can test a model, while listening preferences require their own evidence.
The same energy questions help explain a swing or a vibrating structure: which mode is excited, what force supplies work, and where does energy leave? Specific systems need their own parameters.
Draw a 20 cm line and mark both ends. Sketch one loop, then two, then four on separate equal spans. Mark the zero-displacement points shown in the supplied reference.
Fold a strip in half, then quarters. Unfold it beside your spans. The marks locate nodes in modes 2 and 4; they are position markers, not measured vibration patterns.
Place a paper marker at the midpoint. Predict which of modes 1–6 are missing from an ideal pluck. Check the virtual mode tray. Then use the ruler to place it at one-fifth and try again.
Draw a separate 10 cm span. Predict its fundamental compared with the 20 cm one, holding tension and density fixed. Write what the diagram changes and what it cannot measure.
Use the calculated frame sheet to compare 1 mm and 2 mm plucks at 0.001 second. Identify the same model frequencies, doubled amplitudes and quadrupled initial energy. Name a node shared by every mode.
Can a pluck change the mixture while keeping the ideal fundamental the same?
The paper is a position model, not a vibrating-string experiment. Optional observation of an existing guitar should use only a gentle ordinary pluck at low volume. Do not retune, over-stretch, open, modify or add objects to the instrument. No lasers, flame releases, stretched bands or loud-sound challenges.
Its initial energy becomes four times as large. Initial energy is proportional to h² at fixed system parameters.
The fundamental doubles. The fundamental wavelength halves while wave speed stays fixed.
Even-numbered modes. Their projection at a = 0.5 is zero.
Yes: other modes can move it. A mode shape is one component of the sum.
Average input power balances loss. The driver supplies work while damping removes energy.
The driver can transfer positive work efficiently. Instantaneous input power is force times velocity.
Help couple vibration into air, with its own response. The bridge, body and air form an interacting passive system.
No: pressure and string motion are different observables. What is measured and where it is measured matter.
Research-lab educational derivation. Its existing drawings and recordings are not copied as product assets.
UNSW Music Acoustics · strings and harmonicsSupports physical context; the local model does not solve the full coupled instrument.
UNSW Music Acoustics · how a guitar worksOriginal experiment with 44,100-line/s camera. The 196.36 Hz source case is separate from the authored 110 Hz reference. Figure 3a extracted raster, CC BY 3.0.
Kartofelev, Arro & Välimäki (2019)Original measurements and simulation of an unstrung travel-guitar body as a step toward coupling. No figures from this paper are redistributed.
Brauchler et al. (2019) · string–soundboard couplingFreely suspended top plates, not complete played guitars. Figure 5 combines actual construction photographs and mobility measurements, CC BY 4.0. Mode agreement is not a perceptual quality score.
Brauchler et al. (2023) · braced soundboardsFigures 1–3, CC BY 4.0. Body peaks 104.7 and 111.1 Hz are source observations; unresolved work and Q conventions are not used to calibrate this lesson.
Su et al. (2024) · guitar body measurementsActual laser/pickup signals and separately labeled simulation. Source photographs are a simplified electric-guitar research platform, not the original 3D acoustic guitar. CC BY 4.0.
Jasiński et al. (2025) · sensor comparisonNo loudness challenge or instruction to turn sound up until a signal is detectable. Digital volume cannot establish sound pressure at a user’s ear.
NIDCD · noise-induced hearing lossIndependent subject review is pending.
Read the sources and model assumptions Interactive exploration
Start with a vibration. Follow air, eardrum, tiny bones and hair cells, then see why the message reaching your brain is a different kind of signal.
 Interactive exploration
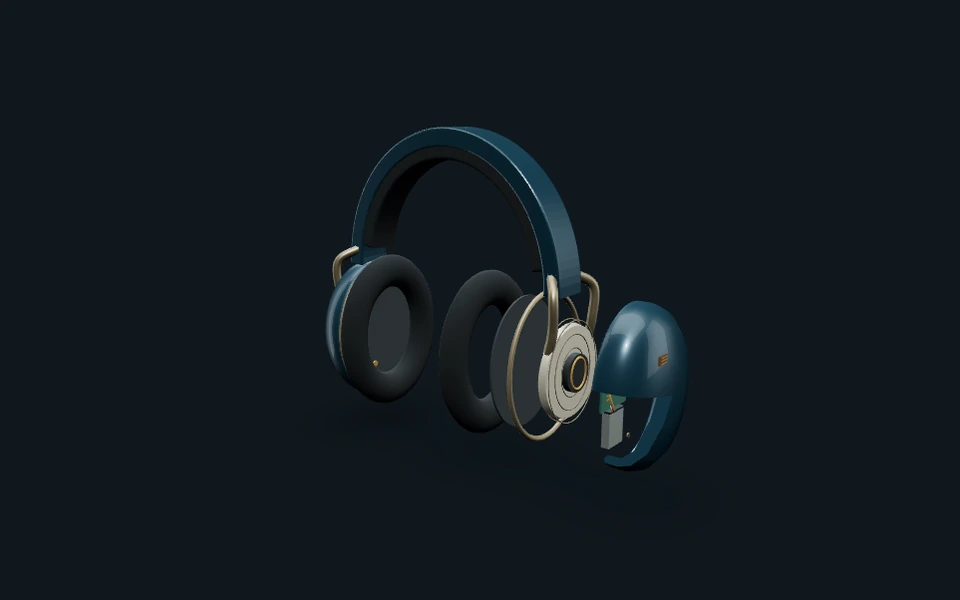
Open a headphone, line up two pressure changes, then keep your setting while the sound changes. Discover why timing, microphones and location matter—and inspect a real measured acoustic path.
 Interactive exploration
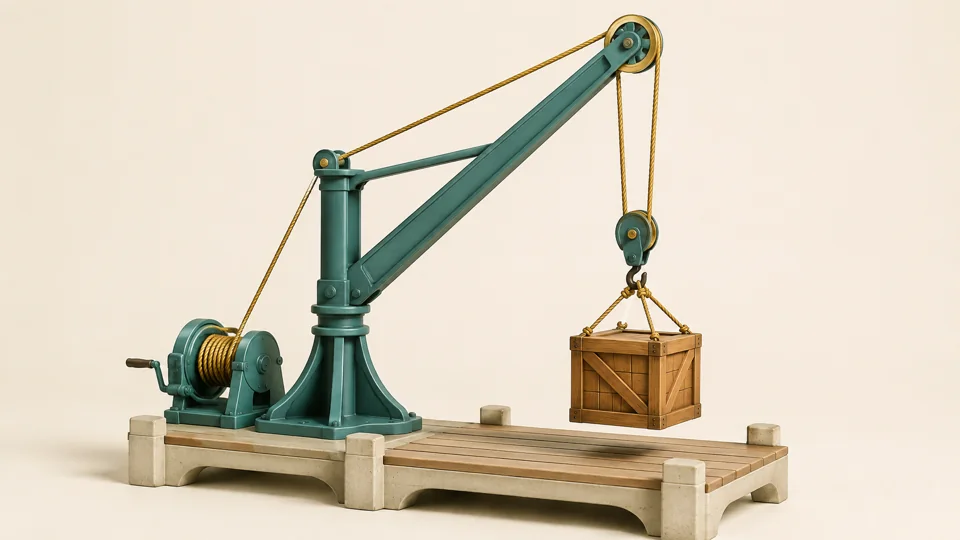
Rerig a dock crane. Pull the same length of rope, watch the crate rise, and see what you trade for an easier lift.